Get started with a 2-month free trial

With OmnibusX installed on your desktop, you can securely manage, access, and analyze your data in a user-friendly environment.

Whether you're working with transcriptomics, spatial analysis, or other biological data, we has the tools you need to unlock new insights and accelerate your research.

Available Omics

Stay up-to-date with our continuously developed tools.

scRNA-seq

Available

spatial RNA-seq

Available

bulk RNA-seq

Available

scATAC-seq

Available

Comprehensive multi‑omics analysis, all-in-one platform

Analyze scRNAseq, scATACseq, spatial transcriptomics, and bulk RNA‑seq data in a single, integrated environment.
From clustering and batch correction to cell type prediction, TCR/BCR analysis, genome browsing, and advanced visualizations.
OmnibusX puts publication‑ready insights at your fingertips.

OmnibusX - visium HD, spatial transcriptomics
OmnibusX - genome browser, chromatin accessibility, scATAC-seq, multi-omics
OmnibusX - differential chromatin accessibility, scATAC-seq, multi-omics
OmnibusX - single-cell analysis
OmnibusX - composition analysis for categorical metadata
OmnibusX - composition analysis for numerical metadata
OmnibusX - composition analysis for groups
OmnibusX - visualize gene expression with violin plot
OmnibusX - visualize gene expression with box plot
OmnibusX - visualize gene expression with bar plot
OmnibusX - visualize gene expression with bubble plot
OmnibusX - differential expression genes
OmnibusX - differential enrichment analysis
OmnibusX - DEGs heatmap
OmnibusX - enrichment analysis with ANOVA test
OmnibusX - enrichment analysis heatmap
OmnibusX - cell type markers heatmap
OmnibusX - cell-cell interaction
OmnibusX - GeoMx DSP, spatial transcriptomics
OmnibusX - TCR/BCR analysis diversity analysis
OmnibusX - TCR/BCR analysis overlapped repertoire analysis
OmnibusX - TCR/BCR analysis spectratype consensus sequence
OmnibusX - pseudotime trajectory analysis
OmnibusX - pseudotime cell-state density analysis
OmnibusX - pseudotime fate-probability analysis
OmnibusX - pseudotime gene trend analysis heatmap

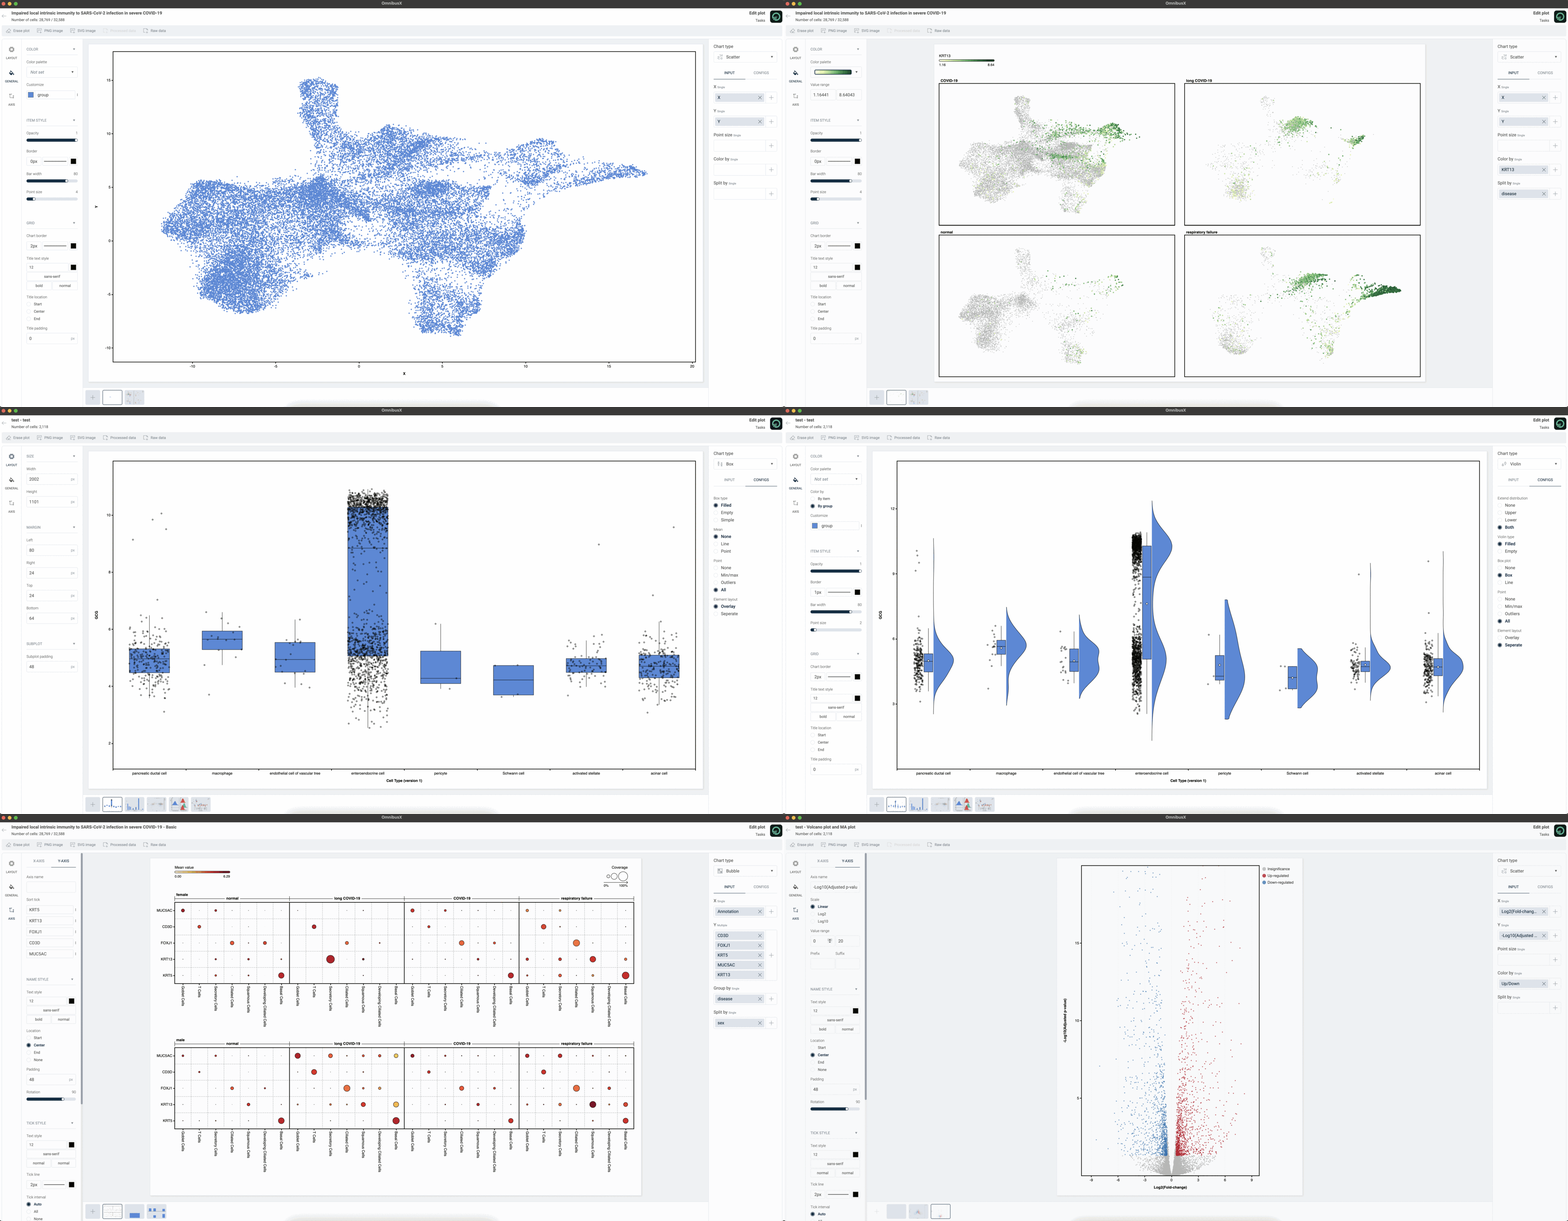
Effortless plot creation and customization

Quickly generate and customize plots to fit your needs. With intuitive interface, you can create clear, publication-ready visuals in seconds without any coding. We supports a wide range of chart types, from classic to modern, and simple to complex, including bar plot, box plot, violin plot, line plot, scatter plot, histogram, composition chart, bubble plot, and more.
Optimized for every step of your workflow

Enhance productivity with powerful processing, intuitive visualizations, and robust data management.

Effective computational methods

A suite of optimized tools for data processing. Designed to ensure efficient analysis on your personal desktop.

Intuitive visualization techniques

Simple clicks are all it takes to extract and visualize data. Makes complex data accessible and engaging.

Secure data management

Manage and organize all your project's datasets directly on your personal desktop, ensuring complete privacy and security.